
DSSSB - 29 August 2019 (Shift-1)
Nursing Research & Statistics
Hard
The following line graph shows the temperature recorded at different time intervals in a day. What is the highest percentage increase recorded?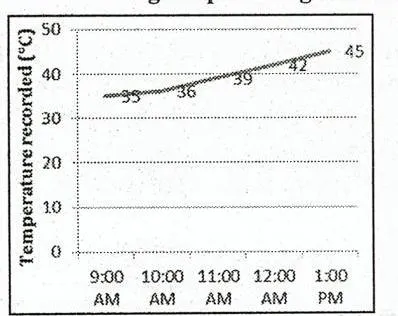
Appeared in: DSSSB - 29 August 2019 (Shift-1)
Explanation
- The question asks for the highest percentage increase between consecutive time intervals shown on the line graph.
- To solve this, one must calculate the percentage increase for each interval using the formula: [(New Value - Old Value) / Old Value] × 100.
- The data points are: 9 AM (35°C), 10 AM (36°C), 11 AM (39°C), 12 PM (42°C), and 1 PM (45°C).
- The increase from 10:00 AM (36°C) to 11:00 AM (39°C) is 3°C.
- The percentage increase for this interval is (3 / 36) × 100 = 8.33%.
- Comparing this with the percentage increases of other intervals (2.86%, 7.69%, and 7.14%), 8.33% is the highest.
Why Other Options Were Wrong
- Option A: This value is not derived from any of the interval calculations. For example, an increase of 10.5% from 35°C would be 38.675°C, not 36°C.
- Option C: This value is not obtained from any of the interval calculations. The closest calculation is 7.69% for the 11 AM to 12 PM interval.
- Option D: This value is not obtained from any of the interval calculations. The closest calculation is 7.14% for the 12 PM to 1 PM interval.
Related Visual

Clinical Relevance
- Nursing practice connection: This is primarily an exam-oriented knowledge point with limited direct bedside application, so retain Calculating the highest percentage increase from data presented in a line graph as background academic context rather than a clinical decision trigger.
- Understanding percentage change is crucial in nursing for monitoring patient progress. For example, calculating the percentage of weight loss in a patient with cachexia or the percentage reduction in a wound's surface area.
- It is also used to assess the response to treatment, such as the percentage decrease in tumor size or the percentage change in lab values like creatinine or liver enzymes.
- What if? If the temperature at 10:00 AM was 35.5°C instead of 36°C, the increase to 39°C at 11:00 AM would be [(39 - 35.5) / 35.5] * 100 = 9.86%, which would then be the highest percentage increase.
How to Approach the Question
- First, carefully read the question to understand that you need to find the 'highest percentage increase', not the highest absolute increase.
- Next, extract the data points for each time interval from the line graph. Write them down to avoid errors: (9 AM, 35), (10 AM, 36), (11 AM, 39), (12 PM, 42), (1 PM, 45).
- Recall the formula for percentage increase:
[(New Value - Old Value) / Old Value] × 100. - Systematically apply this formula to each consecutive pair of data points.
- Calculate the result for each interval: 9-10 AM, 10-11 AM, 11 AM-12 PM, and 12-1 PM.
- Compare the calculated percentages and identify the largest value. Match this value to the given options.
Concept Tested & Keywords
- Concept Tested: Calculating the highest percentage increase from data presented in a line graph.
- Stem keywords: line graph, temperature, time intervals, highest percentage increase
- Lead-in keywords: What is
Question ID
QDNWPCLNG7P0-qopfkN17
Reference Book
E6 NursingResearch Sukhpal Kaur pp. 428-430, 432-434
Practise the full DSSSB - 29 August 2019 (Shift-1)
Attempt every question from this paper in a timed mock, then review the full solution for each one.
More Data Analysis and Stats Questions
- 2450 boys and 1750 girls are examined in a test; 42% of the boys and 36% of the girls pass the test. The percentage of the total who failed is?
- The following bar graph shows the production of maize (in million tonnes) over different years. In which year the highest growth in production of mai…
- The following line graph shows the production of two products A and B in a company over different years. In which year is the combined production of…
- The following table shows the revenue generated (in 000s) for different toothpaste brands in different cities. What is the average revenue generated…
- The curve that is obtained by joining the middle top points of a rectangular bar graph with a straight line is a?
- Which among the following is a non-parametric test?
- The average of 10 observations is 40. Later it is found that one observation was wrongly read as 31 instead of 44. Find the correct average.
More DSSSB - 29 August 2019 (Shift-1) Questions
- Find the missing number in the following number series. -12, -6, \ \ , 9, 18
- Which of the following cubes in the answer figures CANNOT be made based on the unfold cube in the question figure?
- Out of the given options, three are similar in a certain manner. However, one option is NOT like the other three. Select the option which is differen…
- Which two numbers should be interchanged to make the below equation mathematically correct? 7 + 16 / 4 \ 3 - 5 \= 10
- Select the option that is related to the third number on the same basis as the second number is related to the first number. 0.14 : -7.143 :: 0.17 : ?
- A person walks 6 km towards north, then turns towards west and walks 3 km. He then turns left and walks 4 km, and then again turns left and walks for…
- Which two signs should be interchanged to make the below equation mathematically correct? 7 \ 3 + 12 / 2 - 4 \= 23
- If in a certain code language AC means 'Party is amazing', DEC means 'amazing and fun', DF means 'fun loving', then what is the code for 'and'?
- Two numbers are 40% and 60% respectively more than a third number. What is the ratio of the first number to the second number?
- Read the given statement and conclusions carefully. Assuming that the information in the statement is true, even if they appear to be in variance wit…