
DSSSB -28 August 2019 (Shift-2)
Non Nursing Subjects
Hard
The following line graph shows the production of two products A and B in a company over different years. In which year is the combined production of A and B the highest?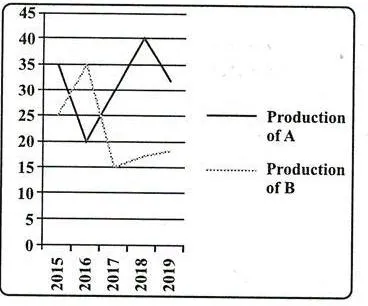
Appeared in: DSSSB -28 August 2019 (Shift-2)
Explanation
- To solve this, you must find the sum of production for both products (A and B) for each year shown in the options.
- In 2015, the solid line (Product A) is at 35 units.
- In the same year, the dotted line (Product B) is at 25 units.
- The combined production for 2015 is the sum of these two values: 35 + 25 = 60 units.
- Comparing this total with the totals from other years (55 in 2016, 40 in 2017, and 57.5 in 2018) shows that 2015 had the highest combined production.
Why Other Options Were Wrong
- Option B: In 2017, the combined production was 25 (Product A) + 15 (Product B) = 40. This is the lowest among the given options.
- Option C: In 2018, the combined production was approximately 40 (Product A) + 17.5 (Product B) = 57.5. While production of A was highest this year, the combined total is less than that of 2015.
- Option D: In 2016, the combined production was 20 (Product A) + 35 (Product B) = 55. This is lower than the combined production in 2015.
Related Visual

Clinical Relevance
- Nursing practice connection: This is primarily an exam-oriented knowledge point with limited direct bedside application, so retain Data interpretation from a line graph as background academic context rather than a clinical decision trigger.
- While this is a general aptitude question, the skill of interpreting graphs is crucial in nursing.
- Nurses frequently analyze charts and graphs to monitor patient vitals (like temperature, blood pressure, heart rate over time), track lab value trends, and interpret growth charts for pediatric patients.
- Accurate data interpretation is essential for making correct clinical decisions and identifying changes in a patient's condition.
How to Approach the Question
- First, understand the question: It asks for the year with the highest combined production of two products.
- Identify the components of the graph: The x-axis shows years, the y-axis shows production units, the solid line is Product A, and the dotted line is Product B.
- For each year listed in the options (2015, 2016, 2017, 2018), carefully read the value for Product A and Product B from the y-axis.
- Calculate the sum of the two values for each year.
- Create a simple table to keep your calculations organized.
- Compare the total (combined) production for each year and identify the largest sum. The year corresponding to this sum is the correct answer.
Concept Tested & Keywords
- Concept Tested: Data interpretation from a line graph
- Stem keywords: line graph, production, products A and B, combined production, highest
- Lead-in keywords: In which year
Question ID
Q8apUkDxS3S78_jXfYYQpT
Reference Book
E6 NursingResearch Suresh Sharma 5e Part 2 p. 128-130
E6 NursingResearch Sukhpal Kaur p. 432-434
Practise the full DSSSB -28 August 2019 (Shift-2)
Attempt every question from this paper in a timed mock, then review the full solution for each one.
More Data Analysis and Stats Questions
- 2450 boys and 1750 girls are examined in a test; 42% of the boys and 36% of the girls pass the test. The percentage of the total who failed is?
- The following line graph shows the temperature recorded at different time intervals in a day. What is the highest percentage increase recorded?
- The following bar graph shows the production of maize (in million tonnes) over different years. In which year the highest growth in production of mai…
- The following table shows the revenue generated (in 000s) for different toothpaste brands in different cities. What is the average revenue generated…
- The curve that is obtained by joining the middle top points of a rectangular bar graph with a straight line is a?
- Which among the following is a non-parametric test?
- The average of 10 observations is 40. Later it is found that one observation was wrongly read as 31 instead of 44. Find the correct average.
More DSSSB -28 August 2019 (Shift-2) Questions
- Read the given statement and conclusions carefully. Assuming that the information in the statement is true, even if they appear to be at variance wit…
- Out of the given options, three are similar in a certain manner. However, one option is NOT like the other three. Select the option which is differen…
- Five girls took part in a race. Rashi finished before Manisha but behind Garima. Ankita finished before Sakshi but behind Manisha. Who won the race?
- If a mirror is placed on the line MN, then which of the answer figures will be the right mirror image of the given figure?
- Out of the given options, three are similar in a certain manner. However, one option is NOT like the other three. Select the option which is differen…
- Which of the following answer figures completes the series of the question figure?
- Out of the given options, three are similar in a certain manner. However, one option is NOT like the other three. Select the option which is differen…
- Which of the following cubes in the answer figure CANNOT be made based on the unfolded cube in the question figure?
- Which two signs should be interchanged to make the below equation mathematically correct? (56+6) 8 × 3 + 3 \= 18
- Two men Kashish and Yash start from the same point. Kashish walks 0.3 km west, then turns north and walks 0.45 m, then turns to his right and walks 0…