
DSSSB -28 August 2019 (Shift-2)
Non Nursing Subjects
Hard
The following pie chart shows the sales of various items of a stationary shop for a month. If 1500 pens are sold, then how many books are sold by the shopkeeper?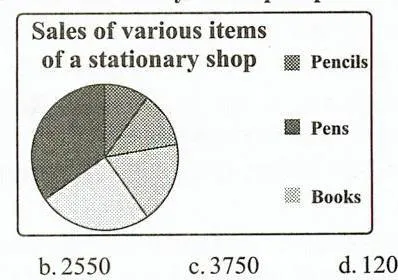
Appeared in: DSSSB -28 August 2019 (Shift-2)
Explanation
- The problem requires finding the number of books sold using the proportion of pens sold, as represented in a pie chart.
- Based on visual estimation, the 'Pens' sector is 90°, which is 25% of the total. Given 1500 pens, the total items sold is calculated as 1500 / 0.25 = 6000 items.
- The number of books is then calculated by identifying its proportion. The correct option, 2550 books, corresponds to 42.5% of the total (2550 / 6000), which is consistent with the 'Books' sector being the largest in the pie chart.
Why Other Options Were Wrong
- Option A: This value might be obtained by assuming a simple ratio, for instance, if one incorrectly assumes the books sector is 120° and pens is 90°, leading to 1500 * (120/90) = 2000. This method is flawed as it does not correctly use the total.
- Option C: If 3750 books were sold, it would represent 62.5% of the total sales (3750/6000), corresponding to a 225° angle. This is visually inconsistent as the 'Books' sector is clearly less than half (180°) of the pie chart.
- Option D: This value is extremely low and represents only 2% of the total sales (120/6000). This is visually inconsistent with the 'Books' sector, which is the largest.
Related Visual

Clinical Relevance
- Nursing practice connection: This is primarily an exam-oriented knowledge point with limited direct bedside application, so retain Data Interpretation from Pie Charts as background academic context rather than a clinical decision trigger.
- While this is a mathematics question, strong numeracy skills are critical in nursing for tasks like calculating medication dosages, titrating IV drips, and interpreting patient data from charts and monitors.
- Errors in calculation can have severe patient safety consequences. For example, miscalculating a drug dose could lead to toxicity or an ineffective treatment.
- What if? If the question stated that pens represented 50% of sales (a 180° sector), the total items would be 3000 (1500 / 0.5). The number of books would then need to be recalculated based on this new total and the book's proportion.
How to Approach the Question
- Identify the core task: Calculate the number of books sold based on the number of pens sold.
- Examine the pie chart for explicit values (percentages or degrees). Note that they are absent.
- Form a hypothesis based on visual cues. The 'Pens' sector looks like a 90° angle, which is 1/4 or 25% of the total.
- Use the given data and your hypothesis to calculate the total. If 25% = 1500, then 100% (Total) = 1500 x 4 = 6000.
- Evaluate the options. Calculate the percentage that each option represents out of the total 6000. For example, 2550 is (2550/6000)*100 = 42.5%.
- Select the option that is most consistent with the visual information in the pie chart (the 'Books' sector is the largest).
Concept Tested & Keywords
- Concept Tested: Data Interpretation from Pie Charts
- Stem keywords: pie chart, sales, stationary shop, pens, books
- Lead-in keywords: how many
- Negative lead-in flag: false
Question ID
QCdQ0LX8O7sgx0FUMZd3Q9
Reference Book
E6 NursingResearch Sukhpal Kaur pp. 428-430, 363-365
Practise the full DSSSB -28 August 2019 (Shift-2)
Attempt every question from this paper in a timed mock, then review the full solution for each one.
More Mathematics Questions
- The ratio of number of girls to boys in a school of 2520 students is 27:29. How many more girls should be admitted to make the ratio 1:1?
- Three candidates contested an election and received 4500, 7500 and 8000 votes respectively. What percentage of votes did the winning candidates get?
- Two bells ring at intervals of 59 seconds and 70 seconds. If they both ring at 10 O'clock in the morning together, after how many seconds will they r…
- The average of four numbers is 61. The largest number among them is 85 and the smallest number is 21. What will be the larger of the remaining two nu…
- In what ratio should water be mixed with milk so that on selling the mixture at cost price a profit of 20% is made?
- A quality control analyst rejects 0.08% of the fabric produced, finding it defective. How many meters of fabric must he examine to reject 4 meters?
- A man traveled from his village to the post office at a speed of 25km/hr and returned at a speed of 4km/hr. If the entire journey took 5 hours and 48…
- A train is running at 60 km/hr. How much time will it require to cross a 2 km bridge?
- The average monthly income of R1 and R2 is Rs. 99,500. The average monthly income of R2 and R3 is Rs. 1,15,600 and the average monthly income of R1 a…
- If Rohan bought 20 books at the rate of Rs. 120 each, 30 books at the rate of Rs. 150 each, and 15 books at the rate of Rs. 100 each, then find the a…
More DSSSB -28 August 2019 (Shift-2) Questions
- Read the given statement and conclusions carefully. Assuming that the information in the statement is true, even if they appear to be at variance wit…
- Out of the given options, three are similar in a certain manner. However, one option is NOT like the other three. Select the option which is differen…
- Five girls took part in a race. Rashi finished before Manisha but behind Garima. Ankita finished before Sakshi but behind Manisha. Who won the race?
- If a mirror is placed on the line MN, then which of the answer figures will be the right mirror image of the given figure?
- Out of the given options, three are similar in a certain manner. However, one option is NOT like the other three. Select the option which is differen…
- Which of the following answer figures completes the series of the question figure?
- Out of the given options, three are similar in a certain manner. However, one option is NOT like the other three. Select the option which is differen…
- Which of the following cubes in the answer figure CANNOT be made based on the unfolded cube in the question figure?
- Which two signs should be interchanged to make the below equation mathematically correct? (56+6) 8 × 3 + 3 \= 18
- Two men Kashish and Yash start from the same point. Kashish walks 0.3 km west, then turns north and walks 0.45 m, then turns to his right and walks 0…