
RRB Nsg. Superintendent-20 July 2019 (Shift-3rd)
Nursing Research & Statistics
Easy
Which is not a measurement of central tendency?
Appeared in: RRB Nsg. Superintendent-20 July 2019 (Shift-3rd)
Explanation
- Standard deviation is a measure of dispersion, not central tendency.
- It quantifies how much the values in a dataset are spread out from the mean (average).
- A low standard deviation indicates that the data points tend to be close to the mean, whereas a high standard deviation indicates that the data points are spread out over a wider range of values.
- In contrast, measures of central tendency (mean, median, mode) aim to identify a single, typical central value.
Why Other Options Were Wrong
- Option A: Median is a primary measure of central tendency. It represents the middle value of a dataset when it is sorted in ascending or descending order.
- Option B: Mode is a measure of central tendency. It represents the value that appears most frequently in a dataset.
- Option C: Mean, or the average, is the most common measure of central tendency. It is calculated by summing all values and dividing by the number of values.
Related Visual
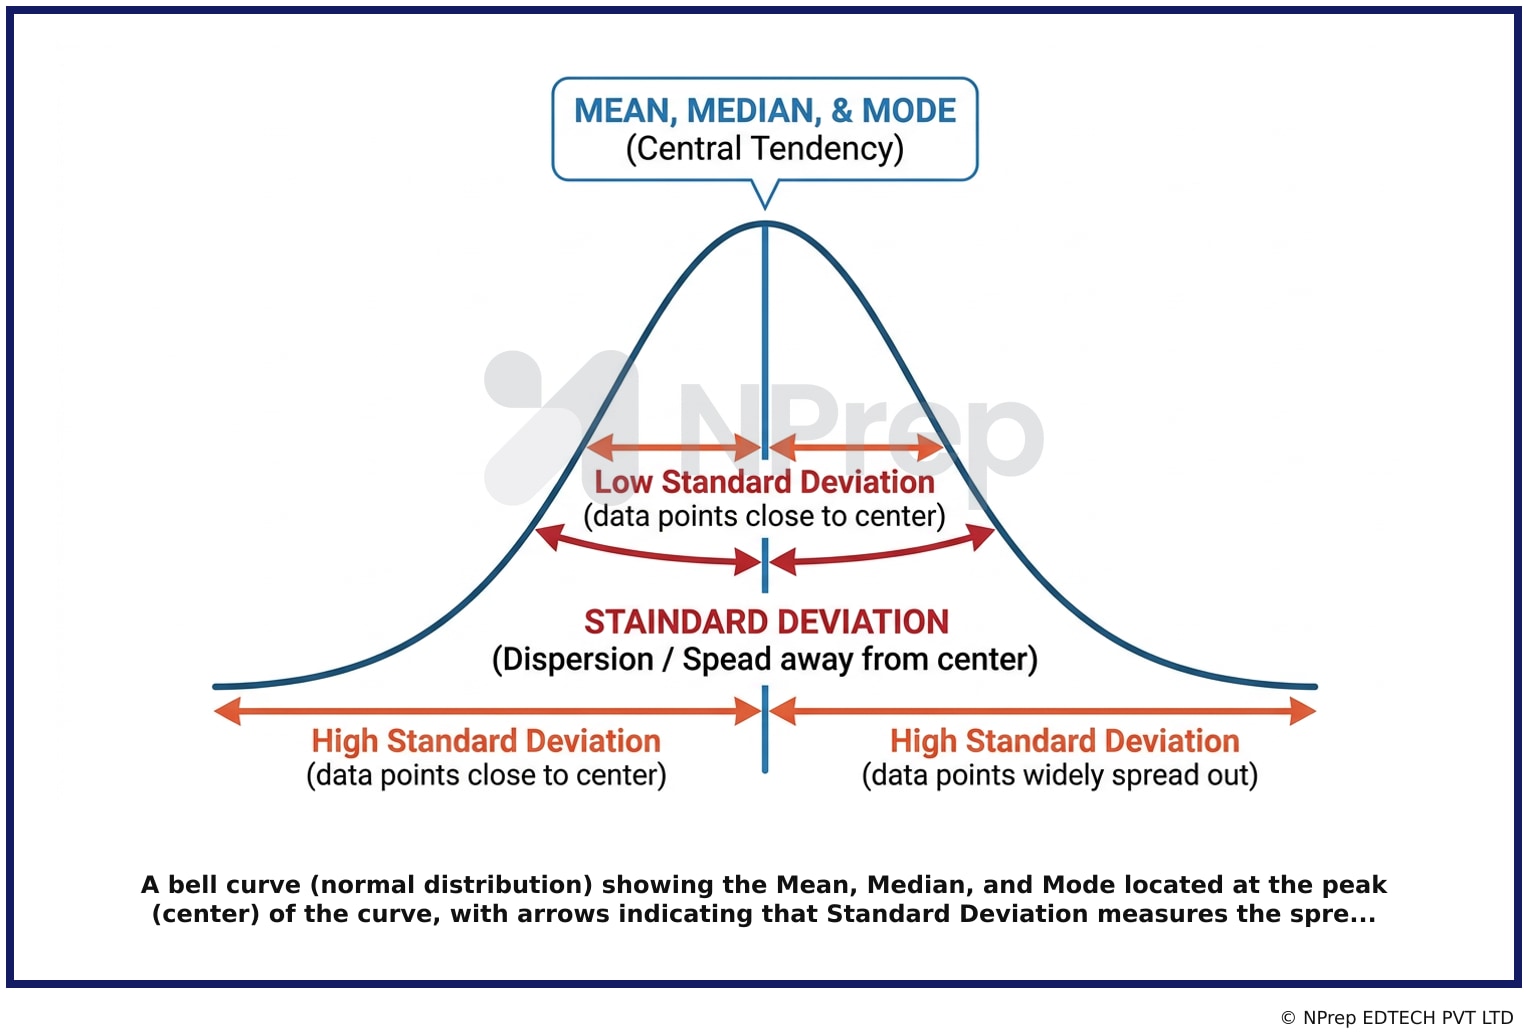
- Visual 1: Diagram - A bell curve (normal distribution) showing the Mean, Median, and Mode located at the peak (center) of the curve, with arrows indicating that Standard Deviation measures the spread away from the center.
Clinical Relevance
- Nursing practice connection: This is primarily an exam-oriented knowledge point with limited direct bedside application, so retain Difference between measures of central tendency and measures of dispersion in statistics as background academic context rather than a clinical decision trigger.
- Nurses use central tendency to understand typical patient data, such as the average (mean) blood pressure in a group of patients with hypertension.
- Dispersion is equally important. A high standard deviation in a patient's daily glucose readings indicates poor glycemic control, even if the mean reading is acceptable. This variability signals a need for intervention.
- What if? If a nurse is tracking post-operative pain scores (0-10) and the mean is 4, but the standard deviation is also 4, it means the pain experience is highly variable. Some patients have little pain while others have severe pain, requiring individualized assessment rather than a one-size-fits-all approach.
How to Approach the Question
- First, identify the negative keyword 'NOT'. This tells you that three of the options fit the category in the question, and one does not.
- Next, define the key concept: 'Measures of central tendency'. Recall that these are statistics that represent the center of a dataset (e.g., mean, median, mode).
- Evaluate each option against this definition.
- Option A (Median), B (Mode), and C (Mean) are all classic examples of measures of central tendency.
- Option D (Standard deviation) measures how spread out the data is, which is a measure of dispersion or variability, not central tendency.
- Therefore, Standard deviation is the correct answer because it does not fit the category of a measure of central tendency.
Concept Tested & Keywords
- Concept Tested: Difference between measures of central tendency and measures of dispersion in statistics.
- Stem keywords: measurement, central tendency
- Lead-in keywords: not
- Negative lead-in flag: The question asks to identify the option that is NOT a measure of central tendency.
Question ID
QaEjU9PQish7PfOYTorZru
Practise the full RRB Nsg. Superintendent-20 July 2019 (Shift-3rd)
Attempt every question from this paper in a timed mock, then review the full solution for each one.
More Introduction to Statistics Questions
- In a Hospital, the following age group of children admitted affected by Influenza: 13, 13, 16, 17, 17, 17, 18, 20, 21, 22. Which of the following sta…
- Mention the level of measurement the following example falls under: Health status: Poor, Fair, Good, Excellent?
- In a calculation of central tendency, the most frequently occurring value is .............
- The value of the highest frequency in the data is?
- In statistics, the spread of dispersion is described with the help of?
- The purpose of a nominal scale?
- Which is the most frequently occurring value in a data set?
- Which of the following is a measure of central tendency?
- Average that is used to derive the central tendency?
- If scores of a sample are distributed as 4, 6, 8, 3, 7, 8, 3, 9, 6, the mean is?
More RRB Nsg. Superintendent-20 July 2019 (Shift-3rd) Questions
- Where is oxytocin synthesized?
- What is the name of the muscle that extends from the sphenoid bone to the mandible?
- Complementary feeding should be initiated at the completion of \ \ \ \ \ \
- Where is kidney located?
- Psychosocial development stage for infants is \ \ \ \ \ \ \ \ \ \
- What immunization is given at birth?
- Functional nursing is a method of providing
- Which disease is the dementia associated with asymmetric atrophy of the frontal and temporal lobes?
- Thromboangiitis obliterans is also known as
- What is the other name of pyridoxine?